Christmas is coming…

Santa Excel

Everyone is subscribing to make sure they don't miss out on their exclusive Secret Santa Gift

From the Not Just Numbers blog:

Are you all ready for Christmas? If you’re one of those people who have had all of your presents in for weeks, I don’t want to know – it only makes me feel inadequate!

One present I have got ready though is myexclusive Secret Santa gift for my subscribers, which will be emailed out on Christmas day.

If you haven’t already subscribed, do it now in the box on the right of the blog – so Santa doesn’t miss you out!

Today’s post is a little different, I just wanted to pick up on some of the feedback I received from my post a couple of weeks ago, asking what you wanted to learn from the blog.

Thanks again for the response, it’s great to know that so many people are appreciating my posts and to find out what you want to see in the future. After all, a blog is worth nothing without its readers! 

Last week I picked up on Bob’s request to learn how to prepare a simple cashbook – I hope that did the job for you Bob!

Some other requests, which I think will make their way into future blog posts are:

  • A few of you wanted to know more about pulling data into Excel from accounting systems, such as Sage. I have posted on this before, but didn’t really cover the detail
  • There were a number of requests for more on charts (including sparklines) and pivot tables
  • Another popular request was a simple cashflow forecasting spreadsheet
There were also a few things requested that I think I have covered in earlier posts, although they may benefit from a revisit:
I also received a couple of requests for more on VBA, however this is an area I intentionally avoid on the blog, as the readership is primarily made up of Excel users rather than programmers. VBA is a massive area in itself, which has much more to do with programming than with Excel. In my experience, most Excel challenges can be handled without VBA, as long as a little creativity is applied.
There are many blogs out there that do a very good job on VBA, for those who do want to read more on it.
I also received a few meatier requests that go beyond a single blog post, and these might be more appropriately addressed in future video training packages, for example:
  • Automating the management accounts process
  • More depth on my OAP approach
Thanks again for all the feedback, keep it coming!

Well, if you’re are one of those that still haven’t subscribed, that’s it for 2012. Unless you go to the top of the blog and subscribe now.

If you have subscribed, you’ll be hearing from me on Christmas Day, with your exclusive Secret Santa Gift.

Either way, have a fantastic Christmas break and I look forward to continuing our journey together in 2013.

Back to the Christmas Shopping!

If you enjoyed this post, go to the top of the blog, where you can subscribe for regular updates and get your free report “The 5 Excel features that you NEED to know”.

EXCEL TIP: A simple cashbook – the OAP way

CashBook

From the Not Just Numbers blog:

Thanks everyone for your response to last week’s post, telling me what you want to learn from the blog. I’ve had some great input and will be including some of your requests over the coming weeks. If you haven’t yet submitted a request, I’d love to hear from you, just enter it here.

One request was from Bob, an accountant:

“I would like to know the simplest way to create a cashbook for my clients that enabled them to record their income and expenditure and be able to have a quick snapshot of their business- a poor man’s QuickBooks if you like.
I have tried several times but end up with 100+ worksheets.”

I have not seen Bob’s spreadsheet, but I have seen many like it and the problem always comes down to the approach taken. Without knowing how to break an Excel job down,  we end up with a complex beast that still doesn’t really do the job. This is why I developed my OAP approach which breaks any Excel job down into three steps:

O – Obtain the data
A – Analyse the data
P – Present the results

By breaking the job down like this, each stage can be focused on its purpose – providing the best input for the next stage.

The accountant’s idea of a cashbook developed on paper, where all of these parts of the job needed to be done as part of the same “worksheet”, otherwise you would be increasing the workload by having to rewrite information. This rewriting costs no time in a spreadsheet, therefore a different approach can, and should, be taken.

O – Obtain the data

For this job, Bob needs a simple data entry sheet where his client can enter each of the transactions, one row per transaction, in one long table, month after month, year after year. This is the best form to capture the data to make it easy to analyse.

The data entry is done in columns A to E. We will discuss columns F to I later in this post.

The following blog posts might be useful in understanding this approach:

The Type and Expense/Income Name columns are dropdowns, Type being a simple dropdown with the choices being Receipt or Payment, the Expense/Income Name column dropdown being driven by an editable list on a separate sheet:
The Name column (A) is used to drive the list. The category column on this sheet is another simple dropdown (Income or Expenditure), which we will use later. 

A – Analyse the data

Once the data entry sheet is in this format, we can use formulae in columns F to I, to calculate the additional information we need to provide the numbers that we will ultimately present.

Columns F and G use the YEAR and MONTH functions to strip out the year and month from the date field so that we can filter reports by these values.

Column H is a simple IF statement that returns the value if column B says “Receipt”, otherwise it returns the value times minus one:

=IF(B2=”Receipt”,C2,-C2)

Column I uses VLOOKUP to return the category column for the categories list above.

P – Present the results

Finally, we use a Pivot Table to present the results:
You can now report on the data for any month or a whole year, from the dropdowns at the top and we have three worksheets – one for data entry, one for the report, and one to enter the information for the dropdown lists.
Although this is a very simple cashbook, the same principles can be used to both add additional data entry columns, and different reports – running off the same data list.
As a response to Andrew, another accountant who asked that I provide more examples of the spreadsheets used, you can download this one here.
There is protection on the data entry and list sheets that you will need to turn off to view the formulae, which you can do by selecting Unprotect Sheet from either the Review ribbon, or the Tools Menu (under the Protection subheading), depending on which version of Excel you are using – there is no password.

If you enjoyed this post, go to the top of the blog, where you can subscribe for regular updates and get your free report “The 5 Excel features that you NEED to know”.


EXCEL TIP: Creating a rolling graph

Rolling GraphFrom the Not Just Numbers blog:

A time-taking Excel task that I see many clients accepting as necessary, is copying and pasting graph data every month to populate graphs that show a rolling twelve months. The data is copied and shifted back a month – pasting over the oldest month – with the new month’s data entered in the gap.  As well as the time taken, this also has the drawback of losing historical data. The problem is only intensified if we are looking at weekly, or even daily, data.

Another approach I have seen is to enter the data continuously and edit the graph source data to look at the new range. This can still be very fiddly and even more hassle when there are multiple graphs.

If we apply my OAP approach to the problem, we come up with a different approach that requires little more than entering the new month’s data.

We first of all look at Obtaining the data. The simplest way to collect the data is to continuously enter the months as they occur – just entering each new month in a column out to the right.

We then look at Analysing the data – well, here we want to see whichever 12 months we wish to report on in the same place every time, so that we do not need to move data, or redirect the graphs.

Finally, we Present the data by pointing the chart at the 12 month sheet.

We just need a simple system to populate the graph data sheet with the 12 months.

The OFFSET function is a great tool for this.

Enter the month at the top of each column in the main data sheet, going out to the right as far as you want into the foreseeable future and enter the data each month as it happens, e.g.

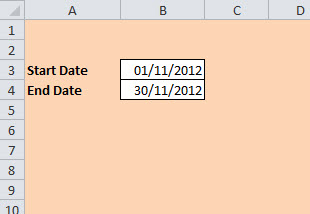
On a second tab you want a similar layout but with only 12 months. The only data you enter on this tab will be the current month (in cell M2). I have used the date format mmm-yy throughout with all dates being the first of the month.

The month in cell L2 is calculated using the formula

=DATE(YEAR(M2),MONTH(M2)-1,1)

this can then be copied back along the row as far as B2, each time it calculates the 1st of the month before. The DATE function is covered in this earlier post.

Then cell B1 includes the function:

=MATCH(B2,’Data Entry’!$2:$2,0)-1

This looks for the date that is in B2, in row 2 of the Data Entry sheet and returns how many columns along it finds it. I have deducted 1 from the result to provide the number of columns to offset from column A to find the correct data.

Cell C1 is just B1+1, continuing in the same vein along the row to M1 (=L1+1).

We then use the OFFSET function in the data fields to use the number in row 1 to pull in the correct data from the data entry sheet.

The formula in the first item of data in cell B4 is:

=OFFSET(‘Data Entry’!$A4,0,’Graph Data’!B$1)

This returns the cell that is offset from cell A4 of the data entry sheet by zero rows and B1 (11 in the example) columns.

Notice the dollar signs. By applying the dollar signs as we have, when copied along the row, the formula will continue to look at column A of the data sheet, and when copied down, it will continue to look at row 1 of the Graph Data sheet. Meaning that the formula can be copied all the way across and down to as many data fields as we want to add.

Set up all of your graphs to point at the 12 months on the Graph Data sheet and you will never need to change them.

In future, you just need to enter the data in the data sheet as it becomes available, and enter the last month of the 12 month period you want your graphs to look at in cell M2 of the Graph Data sheet.

I hope you’ve found this useful. I am currently planning some video training packages and I would really appreciate it if you could use the comments below this blog post (and others in future), to let me know what you find most useful about these posts – and what you don’t – to help direct my planning.

If you enjoyed this post, go to the top of the blog, where you can subscribe for regular updates and get your free report “The 5 Excel features that you NEED to know”.

EXCEL TIP: How to make data entry screens easy to use

From the Not Just Numbers blog:

Most spreadsheets require some kind of data to be entered into cells by the user and there are a couple of simple steps you can take to make this a lot easier for the user to do.

Use colour
First of all, use colour to make it easy to see which cells require data entry. I find that using a quite light colour for the rest of the sheet and “No Fill” for the data entry cells tends to suggest that these are the ones that require input.

Take a look at the example below:

Use protection
No, this is not a safe sex tip. You can use the protection feature in Excel to guide people to those cells by stopping them being able to click in the other cells on the sheet.

Do this by highlighting the data entry cells, selecting “Format Cells”, and on the Protection tab, unticking the box that says “Locked”.

Then select “Protect Sheet” from the Review tab on the ribbon (or from Tools -> Protection in older versions of Excel). Then untick the box under “Allow all users of this worksheet to:” that says “Select locked cells” (it is up to you whether you use a password, but it is not necessary for this purpose).

This will stop the user from clicking in any of the other cells on the sheet, and will even allow you to use the TAB key to toggle through the data entry cells.

That’s it for this week. Short but sweet!

If you enjoyed this post, go to the top of the blog, where you can subscribe for regular updates and get your free report “The 5 Excel features that you NEED to know”.

EXCEL TIP: Using data in sentences

Letters

From the Not Just Numbers blog:

Microsoft Office users will tend to use Excel to handle numbers and data, and Word to handle text – which, of course, is how it should be.

Although, I know many accountants who would use Excel to write letters if they could – and many Office users who are not au fait with the workings of spreadsheets that will stretch Word’s data handling capabilities well beyond what is decent!

There are, however, legitimate reasons for using text in Excel and some very useful functions that make it work well.

In particular, I am thinking of those times where we want to write sentences that use data.

Some examples are:

  • Spreadsheet headings that might include a date, or a department name;
  • Notes to accounts that might refer to actual money values within a sentence.

I am sure you can think of many more.

Excel has a really simple way of handling this. and at the heart of it is the ampersand character (&).
The ampersand character can be used to join any pieces of text together in a formula. This text can be actual text (included in quotation marks), or references to text.

So, for example:

=”My spreadsheet”&” won’t work” returns My spreadsheet won’t work


or more usefully:

=”Balance Sheet as at 31st March “&A1 returns Balance Sheet as at 31st March 2012 if cell A1 contains the current year (2012)

=”The Creditors balance of £”&A1&” includes £”&A2&” due to Group Companies” returns The Creditors balance of £35623 includes £5261 due to Group Companies – where cells A1 and A2 contain those numbers

You can even force the format of the data by using the TEXT function. In the example above, replacing A1 with TEXT(A1,”#,##0″) will format it as 35,623. The TEXT function obeys all of the standard rules for formats – including dates, etc.

Now you can stop all that fiddling around with the text elements of your reports and have Excel populate that too!

If you enjoyed this post, go to the top of the blog, where you can subscribe for regular updates and get your free report “The 5 Excel features that you NEED to know”.

EXCEL TIP: Look up commission or tax rates from earning bands

Earnings Bands

From the Not Just Numbers blog:

Just a short post today on a very useful use for the VLOOKUP function.

Typically when we use VLOOKUP, we are looking for an exact match from a list. For example, we might look up a customer’s address, based upon their account code.

But what if we want to look up the correct commission rate or tax rate, based upon what earnings band a particular value falls into?

VLOOKUP handles this extremely well, when you understand its mysterious fourth (optional) argument.

The syntax of a VLOOKUP function is:

=VLOOKUP(lookup value,range to lookup,column to return,TRUE or FALSE)
I you need a recap on using the VLOOKUP function, take a look at my earlier post on the subject.

First of all though, let us outline the problem with an example.

We have a cell (D2) containing an income figure upon which we need to calculate a sales commission.

However, the rate of commission changes depending on the size of the income figure as follows:

0 – 9,999  pays 10%
10,000 – 49,999 pays 20%
and 50,000+ pays 25%

How do we calculate what rate to use?

We could use IF statements, however this falls down with more bands and is very inflexible when it comes to changing the bands. A far better solution is to use the VLOOKUP function.

We need to create a two column table with the start of the band in the first column, and the rate to use in the second. This table must be in ascending order of earnings, i.e.

When we set the final argument in the VLOOKUP to TRUE (or leave it blank), it scans the lookup table for the highest earnings value that is still less than the lookup value, so:

=VLOOKUP(D2,A2:B4,2,TRUE)

will return the rate we are looking for.

We can also use exactly the same approach for other similar problems, such as looking up tax rates.

If you enjoyed this post, go to the top of the blog, where you can subscribe for regular updates and get your free report “The 5 Excel features that you NEED to know”.

Richard Branson, First Group, The Department for Transport and your Excel Spreadsheet

TrainFrom the Not Just Numbers blog:

A major news story in the UK in recent weeks has been the embarrassing U-turn of the government on their award of the West Coast rail franchise to First Group, following complaints from the incumbent, Richard Branson’s Virgin.

Full story here

The problems appear to have been caused by unrealistic assumptions on rates of inflation and passenger growth.

This got me thinking about the use of assumptions and variables in Excel spreadsheets generally.

Obviously, any assumptions should be clearly visible and I would suggest (if space allows) above the forecast (or whatever the main content of the spreadsheet is).

I’m sure we all know this to be good practice but it doesn’t mean we always do it!

A second, slightly more subtle, rule that I always (try to) follow helps avoid so many of these types of errors.

Make these assumptions an active part of the spreadsheet

What I mean by this is instead of entering the text, say, “Inflation is assumed to be at the rate of 2%”, enter the name of the variable in one column and the value in another, e.g.


Then wherever inflation is used in the spreadsheet, always reference this cell (B3 in the example above). This way you always know that what you have stated in the assumptions is what your spreadsheet is using.

You can refer to this cell in two ways, either:

1. Directly, i.e. $B$3 – Note the dollar signs to ensure that if you copy your formula elsewhere in the spreadsheet, it still references the cell, or;
2. As a named range, i.e. name cell B3 Inflation and refer to the range Inflation in your formula.

The second approach makes the formula easier to understand, but the first is usually quicker.

Another significant benefit of this approach is when these rates need to change. I come across so many spreadsheets that calculate VAT (a UK sales tax – currently 20%) on the value in cell A2 as =A2*0.2. When the rate changes, all of the calculations need to be checked, where if the VAT rate had been entered in a cell as above, it would be as simple as changing the rate in that cell!

Simple tips, I know, but many a complex spreadsheet has been brought down by not following them – just ask the Department for Transport!

If you enjoyed this post, go to the top of the blog, where you can subscribe for regular updates and get your free report “The 5 Excel features that you NEED to know”.


EXCEL TIP: Identifying irregular period-ends

Month End

From the Not Just Numbers blog:

A couple of weeks ago I did a post on identifying the calendar month-end from a particular date, and I promised to explain how to do this when your month-ends are irregular – as is still quite common in a manufacturing environment. Here is that post.

You may have any set of rules that govern when the month-end (or period-end if they’re really irregular) is –“last Friday of the month” for example, but there are nearly always exceptions – usually around Christmas and other holidays.

The most flexible way to address this issue is to have a table of month-ends held in the spreadsheet that can be adjusted to whatever you want.

This can be a simple two column table with period start-dates in the first column and period end-dates in the second.

You can then use VLOOKUP to find the first start date that is before the transaction date in question. We can then return the period-end date from the second column.

For example, where the range containing the two-column table described above is called PERIODENDS and the transaction date in question is held in cell A1, we can use:

=VLOOKUP(A1,PERIODENDS,2) to return the corresponding period-end date.

If we wished to return the period number, we could add this in a third column in the table and use:

=VLOOKUP(A1,PERIODENDS,3)

Notice that I have not entered the optional fourth argument in the VLOOKUP function [range lookup]. This argument is normally entered as FALSE if you wish to look for an exact match, but if omitted (or entered as TRUE) the VLOOKUP identifies the first entry in the column (the column must be in ascending order) which is exceeded by the lookup value. In this case, the first period start date that the transaction date exceeds – i.e. exactly what we want!


If you enjoyed this post, go to the top left corner of the blog, where you can subscribe for regular updates and get your free report “The 5 Excel features that you NEED to know”.

EXCEL TIP: Making Accounting periods useful in Excel

File Index

From the Not Just Numbers blog:

Often we have data, particularly in accounting systems, stored by Year and Period Number.

This may be weekly takings, with year being the accounting year and the period number being the week number, or it might simply be account movements or payroll by accounting year and accounting period, 1 to 12.

This is a sensible way to store the data but it can make selecting a range quite tricky, so I thought I would share a little trick I use to simplify this problem.

The problem:

Where data has a date attached, for example a transaction date, or a month end date for the type of data we are discussing here, we can use the following IF statement to determine whether a transaction/movement is within a date range:

Where A2 holds the transaction date and G1 holds the Start Date of the range we want to look at and H1 holds the End Date.

=IF(AND(A2>=$G$1,A2<=$H$1),”Yes”,”No”)

Answers the question whether A2 is within the range G1 to H1.

(If you need a refresher on the IF statement, take a look at my earlier post).

Where we have a Year and Period Number, this doesn’t work. If the range straddles a year end, you want to include, say, period 12 from the first year but not from the second.

The Solution:

To make it much easier, we need to create a working column that combines the two into a sequential number. We can do this with a simple calculation:

Where B2 holds the year and C2 holds the period we can enter the following in D2:

=(B2*100)+C2

This will convert the year and period into a 6-digit number where all periods are in sequence, so…

Where B2=2012 and C2 =7, the formula returns 201200 + 7 = 201207

It is possible that the year and period are held as text rather than as a number, in this case you would use the VALUE function to convert the text to values:

=(VALUE(B2)*100)+VALUE(C2)

If we now state the start and end of the period range in the same format (in cells G1 and H1 as before), we can use the same approach as for dates to identify the range using our working column D, i.e.

=IF(AND(D2>=$G$1,D2<=$H$1),”Yes”,”No”)

Column D could also be used to sort the data, as we now how have a column that identifies the correct chronological order.


If you enjoyed this post, go to the top left corner of the blog, where you can subscribe for regular updates and get your free report “The 5 Excel features that you NEED to know”.

EXCEL TIP: Finding the month end


From the Not Just Numbers blog:

Here is a useful tip for finding the month-end from a transaction date.

I often have a need to identify the month-end date relating to a particular transaction during the month, i.e. we have the date of the transaction and need to return the date of the month-end.

NB: Most businesses in my experience tend to use calendar months for accounting periods these days, however some (particularly in manufacturing) still have month-ends on a particular day of the week. My tip below will only work for calendar months, but I may cover irregular month-ends in a future post (hint, you will need VLOOKUP).

Another NB: It has been pointed out to me by a number of readers that there is a quicker solution than that outlined below for users of Excel 2010. It uses a function which I didn’t know was there as I didn’t need it, having an approach that served me well in earlier versions. In Excel 2010, you can use =EOMONTH(A1,0), where A1 contains the transaction date. The method below is still worth knowing as you will need it if a file has to be accessed by earlier Excel versions. It also uses a number of techniques for manipulating dates that you can use for other purposes.

Here we can use an interesting and very useful feature of the DATE function, along with the YEAR and MONTH functions.

The DATE function returns a date given the year month and day, and is entered as follows:

=DATE(year,month,day)

so =DATE(2012,7,16) returns 16th July 2012 (in whatever date format you have set for the cell).

The YEAR, MONTH and DAY functions work the other way, in that they pull out the year, month and day numbers respectively from a date, so if cell A1 contains the date 16th July 2012, =YEAR(A1) will return 2012.

We could use this to pull out a particular day of the month from any transaction, so if we wanted to return the 25th day of the month of the transaction (where the transaction date,16th July 2012, is held in cell A1), we could use:

=DATE(YEAR(A1),MONTH(A1),25)

which would return 25th July 2012.

However, the actual month-end day obviously varies between the 28th and the 31st. This is where the useful quirk of the DATE formula comes in. Day zero of the month is the last day of the previous month, so

DATE(2012,8,0) returns 31st July 2012.

We can therefore amend the DATE formula above to provide the month end for the transaction date in A1,  to provide:

The Answer:

=DATE(YEAR(A1),MONTH(A1)+1,0)

And don’t worry, those of you who are seeing a potential problem around the year end, when MONTH(A1) equals 13. The month formula works in a similarly useful way, so that month 13 of 2012 is month 1 of 2013, so:

=DATE(2012,13,0) returns 31st December 2012 or even;

=DATE(2012,15,25) returns 25th March 2013.


If you enjoyed this post, go to the top left corner of the blog, where you can subscribe for regular updates and get your free report “The 5 Excel features that you NEED to know”.