Excel Tip: Managing Deadlines in Excel

Deadline

From the Not Just Numbers blog:

Today’s post was prompted by a discussion on the accountants website, AccountingWeb.

One accountant was looking for a simple way to manage client deadlines in Excel, for Corporation Tax returns, VAT Returns, Companies House Annual Returns, etc. Although this example is for accountants, it can be applied to managing any sets of multiple deadlines.

Although there are all sorts of packages out there for doing this kind of thing – and I would suggest using those if your needs are much more complicated than this example – if kept simple, Excel might be all you need.

I have provided a finished (simple) example but will talk you through how to build it.

You can download the finished example, here:

DeadlineManagerExample.xlsx

The spreadsheet is to be used as follows:

  • Enter client details on the data sheet, and the next due dates for each of the returns in the appropriate columns;
  • Refresh the pivot table on the Reports Due sheet, ensuring that the Include drop-down at the top is set to Y;
  • The report is sorted in ascending order by Next (which is the calculated, earliest due date for that client);
  • You can also filter the report by manager using the drop-down at the top.
  • When you have completed a return, update the next due date for that return on the data sheet. When you refresh the pivot table again it will re-sort reflecting the change.

How it works

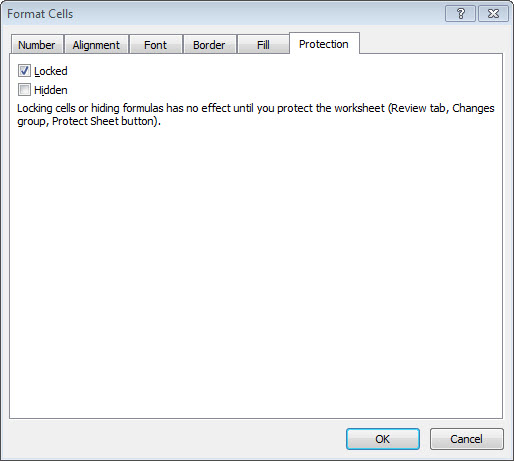
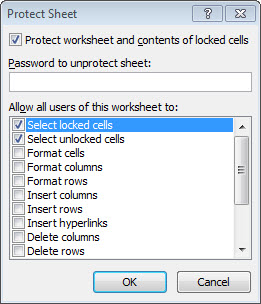
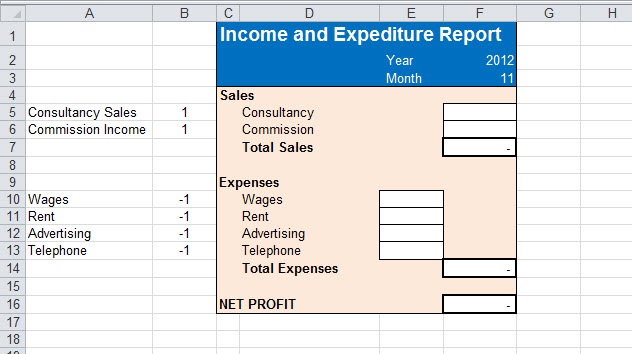
The spreadsheet consists of a simple data sheet, applying my principles for laying out data and using protection and colour to make it obvious where data is to be entered.

There are three deadline dates in the example, but the principles can be applied to s many as you want.

There are also two calculated columns in the protected area (the protection has no password, so it can be switched off if you want to look at or edit these columns).

The first column (column I – Next Due Date) calculates the earliest of the three due dates, using the MIN function. On row 2 this reads:

=MIN(F2:H2

As dates are stored in excel as numbers, the minimum of these three dates is also the earliest. Also note that the MIN function only applies to the numeric fields, so will ignore any cells that do not have a due date.

The second calculated column (column J – Include) is used to exclude any blank rows from the data, as the MIN function will return zero (00/01/1900 in Excel date terms) on these rows, putting them at the top of the list as they are well overdue!

This column simply uses the IF function to return an “N” if the Next Due Date is zero, otherwise a “Y”.

So row 2 reads:

=IF(I2=0,”N”,”Y”)

These two calculated columns have been copied down for 500 rows, but could easily be copied down further if you need more.

The second sheet of the workbook is a Pivot Table, whose source is all of the columns of the Data Sheet.

The pivot table has been created with the Manager and Include fields as Report Filters, and the client information as the rows. All subtotals have been switched off on the client information fields and the pivot table has been set to Classic Layout – this means that we can keep all of the client information on one row.

All of the dates have been set as Value fields, formatted as dates and set to summarise by Min. As there should only be one row per client, Sum, Average or Max would have done as well, however Min seems safer, as the point of the spreadsheet is our interest in the earliest date.

The most important change to the pivot table is the sort. By right-clicking on the Client Name field, selecting Sort -> More sort options, we can set the Client field to sort in order of the Next Due Date, ascending.

This sort is what makes the report useful, as it shows the clients with the earliest Next due date at the top of the report.

The only other changes made to the pivot table were to remove the column totals (they don’t really make sense for dates), and to edit the headings for the value columns to make them more user friendly.

Obviously, this is a simple example and much more complexity could be added, however this would have confused some simple principles.

I hope you find it useful.

Click here for our our exclusive offer on Online Excel Training

If you enjoyed this post, go to the top of the blog, where you can subscribe for regular updates and get your free report “The 5 Excel features that you NEED to know”.


Excel Tip: Protecting cells

Protect Cells

From the Not Just Numbers blog:

One of my ten principles last week was to protect cells with formulae in them, and it occurred to me that it might be useful to do a quick post on how cell protection works.

It is really easy to use and very effective for ensuring that formulae don’t get over-typed.

Protecting cells is a two-stage process:

First of all we choose which cells we want to be locked, and then we switch protection on for that worksheet.

Setting which cells are to be protected

We determine the protection status of a cell by selecting a cell, or cells, and choosing “Format Cells”. This can be accessed from the right-click menu.

The final tab of the window is Protection:

By default, all cells have the Locked box ticked (as shown above). This means that the cell will be locked (and therefore can’t be edited) if the sheet is protected (in the next stage).

If we untick this box, then the cell, or cells, will remain free to edit, when protection is switched on.

We will typically select the data entry cells and unlock them in this way, prior to switching protection on for the sheet.

There is also a second tick box (Hidden) that allows you to hide the formula in the cell (again, only once protection is switched on).

Switch Protection on for the worksheet

In Excel 2007 onwards select the Review ribbon and click Protect Sheet. In earlier versions of Excel, select Tools->Protection->Protect Sheet.

In both cases you will see the following:

The top tick box will always be ticked (you can’t click OK if it isn’t).

Under that, you can choose to enter a password that will be required to unprotect the sheet. You will be asked to enter this twice to avoid mistyping it.

Below that is a list of tick boxes where you can allow things that would otherwise not be allowed on a protected sheet. By default, the first two are ticked, meaning that you are still allowed to select any cells (whether locked or unlocked). On a data entry screen, I often untick the top box, as this stops the user even clicking in cells that can’t be edited – making it easier to navigate the sheet.

Other tickboxes (further down the list) that you may want to tick, are such things as allowing the use of Autofilter, Sort, or Pivot Tables. This form gives quite a lot of control over what the user can or can’t do.

When you are happy with the above, click OK. The protection settings will be applied to the active Worksheet.

To unprotect the sheet again, go to the same place as you did to protect it. You will notice that the option now says Unprotect Sheet. When you click this, you will be asked for the password (if you applied one), and then the sheet will be unprotected again.

If you then go to protect it again, the tick box options are remembered, however you will need to set the password again.

And that’s cell protection!

Click here for our our exclusive offer on Online Excel Training

If you enjoyed this post, go to the top of the blog, where you can subscribe for regular updates and get your free report “The 5 Excel features that you NEED to know”.

Excel Tip: My Ten Principles for Excel Good Practice

10

From the Not Just Numbers blog:

As part of my role on the Institute of Chartered Accountants in England and Wales (ICAEW) Excel Community Advisory Committee, I (along with the other members) have been asked to share my personal principles for Excel good practice – and I thought you might be interested to see them too.

So here goes…

My Ten Excel Principles:

  1. Always separate out the three stages – Obtaining the data, Analysing the data, Presenting the data (OAP). This makes your spreadsheet far more flexible and easy to follow.
  2. Never include numbers in formulae – always enter the variable in a cell and refer to the cell in the formula. This makes the spreadsheet easy to follow and to update when variables change.
  3. Don’t fiddle with the data – when using data from elsewhere, don’t edit it, report on it in other sheets. This minimises errors and increases efficiency.
  4. Use data validation where possible, to minimise data entry errors, and to make it easier to analyse and report on the data.
  5. Always think “Is there a way I could do this that would save me time next time?”
  6. Lay out data to suit Excel – not to suit the eye. Every heading, subtotal or empty column you place among the data makes it far less useable.
  7. Get used to using the dollar signs when you refer to cells. Used well, you can write a formula once and copy it everywhere – Saving time and reducing errors.
  8. Protect cells with formulae in them – it can be very difficult to find an incorrect (or missing) formula caused by accidental typing.
  9. Use colour and formatting (as well as descriptions) to make it obvious where data entry is required.
  10. Avoid merging cells unless absolutely necessary – merged cells make a spreadsheet far harder to edit.

I’m sure I will have missed a few key ones – these are very much my personal ones – and I would love to hear yours in the comments.

Click here for our our exclusive offer on Online Excel Training

If you enjoyed this post, go to the top of the blog, where you can subscribe for regular updates and get your free report “The 5 Excel features that you NEED to know”.


Excel Tip: Don’t hold your data in Excel if you’ve got somewhere better!

Don'tFrom the Not Just Numbers blog:

Just a short post this week, and a one you might be surprised by. I am going to encourage you not to use Excel!

Yes, after years of telling you how to get the best out of Excel, I am going to tell you to avoid using it!

Well at least for one particular purpose…

Whereas a lot of my work is producing spreadsheets that are self-contained, I work with many clients where I use Excel as a tool to report from their database systems (typically accounting packages or ERP/MRP systems).

Many times, these reports are required because the system won’t give them what they want – some of the time because all of the data they need isn’t stored in the system.

In this scenario, it is very easy to store the additional data in the spreadsheet report, but I would urge you – DON’T!

Whereas the report will work just as well, if the additional data is stored in the spreadsheet, the information will not be available from within the system, or for other reports required in future. Very quickly, you can find  various different versions of the same data scattered around in spreadsheets all over the business.

If at all possible, find a way to start recording this data in the system – and use Excel to report on it like the rest of the data.

This is usually possible, although inevitably there are some systems that are not flexible enough for the company’s true needs. Storing the data in a spreadsheet outside of the system will work as a patch, but is not the ideal solution.

Excel is a fantastic tool that has many applications – but it is important to know when not to use it too!

Click here for our our exclusive offer on Online Excel Training

If you enjoyed this post, go to the top of the blog, where you can subscribe for regular updates and get your free report “The 5 Excel features that you NEED to know”.

Excel Tip: Don’t fiddle with the data!

FiddleFrom the Not Just Numbers blog:

Yesterday I had a conversation with a client that I have had, in various forms, many times before.

It relates to using information in a spreadsheet from an external source.

Almost every time I find a client using data from their accounting system, or provided by a supplier, customer or other third party, they approach it in a way that significantly multiplies the work involved and increases the risk of errors.

It’s a shame because all that is required is a different approach, that rarely requires greater Excel skills than they already have.

In most cases the information is received as a spreadsheet – either generated from another software package, or emailed from a third party. Typically this information then needs to be edited and re-formatted to produce the desired end product – which might also have some pivot tables or charts based on the data.

The usual response to this situation is to do just that – take the spreadsheet that has been received and then edit it until it look s how they want it.

Unless this is a truly one-off situation, it is almost certainly the worst route to take, as you will need to do all of this editing again when you receive the next version of the data, next month, next week, or tomorrow!

Applying a little thinking to the situation suggests a much more efficient approach.

You will always receive this data in the same format, and will always require the same output format, so why not use this knowledge.

DON’T EDIT THE SPREADSHEET YOU RECEIVE!

Instead of editing the spreadsheet you receive, paste it into a blank sheet in a new workbook and create the output you want on the other sheets referring to the sheet with the data on it, but not editing the data itself at all.

Doing it this way, means that next month/week/day you can just paste the new data in and your job is done!

You can spend your time getting it right once – reducing the risk of errors – and remove all of the work in future.

Incorrect spreadsheets have hit the headlines in the US this week, with Excel errors discovered in the calculations behind a report by Harvard Economists Reinhart and Rogoff that has been used by Republicans to support budget cuts. Another timely reminder of the potential consequences of not getting these things right.

Click here for our our exclusive offer on Online Excel Training

If you enjoyed this post, go to the top of the blog, where you can subscribe for regular updates and get your free report “The 5 Excel features that you NEED to know”.

Excel Tip: Do you really need to merge those cells?

Merge Cells

From the Not Just Numbers blog:

Just a short one this week, along the lines of my cautionary post a couple of weeks ago on the dangers of cut and paste.

When working on a spreadsheet that someone else has built, there are a number of things that can make life particularly difficult. One of these, which is rarely necessary, is the use of merged cells.

Merging cells allow you to combine one or more adjacent cells into one, usually to allow the cell contents (text or numbers) to be centred, either horizontally or vertically, in the larger combined cell. This is purely a presentation tool, which you can use to make your spreadsheet look better.

To access Merge Cells, you can select the range you want to merge, then either choose format cells and tick the box on the Alignment tab, or use the drop-down in the middle of the ribbon on the more recent versions of Excel.

The purpose of today’s post, however, is not to teach you how to use Merge Cells, but to warn of the dangers of using them unnecessarily, and in the wrong place.

Merging cells in a table in Microsoft Word is great and gives you far greater flexibility in your layout, however Excel has one fundamental difference to a table in Word – these cells contain data and/or calculations, linking them to other cells in the worksheet/workbook. Excel treats the contents of the merged cell as being contained in the top left cell of the merged range.

Regular readers will know of my OAP approach, which breaks your Excel spreadsheet design down into three distinct functions:

  • O – Obtain the data
  • A – Analyse the data
  • P – Present the results

If your spreadsheet follows this approach, then there won’t be too many problems using Merge Cells at the P stage, as this worksheet (or area of a worksheet) will simply be presenting data obtained and analysed elsewhere -and will not be being used as data itself.

Unfortunately, most spreadsheets do not follow this approach and each worksheet tends to include all of these steps.

Now, when making changes to a spreadsheet that includes merged cells, among the data and analysis, we are faced with all sorts of complications, including the following:

  • Data containing merged cells can not be treated like a normal data table – meaning that we can’t use all of the tools that we might want to use for referring to a properly formatted data table, such as pivot tablesSUMIF, etc;
  • Copying and pasting ranges is restricted to those with cells merged in the same way;
  • Fill down doesn’t work if any of the cells in the range to be filled are merged;
  • Even if we unmerge all of the cells, this rarely solves the problem, as this action will assume that the merged cell contents should be placed in the top left cell of the unmerged range – which may not be where you want them to be. Also, having done this, it is often not clear where your data is, as the labels may now be in a completely different place.
These problems can cause huge amounts of extra work when working with a spreadsheet like this. My advice would be to only use merged cells in a sheet that you know is purely for presentation, or that is so simple that it is very easy to see what is going on.

Click here for our our exclusive offer on Online Excel Training

If you enjoyed this post, go to the top of the blog, where you can subscribe for regular updates and get your free report “The 5 Excel features that you NEED to know”.


Online Excel Training – Exclusive Reader Offer

Excel With Business

From the Not Just Numbers blog:

Regular readers will know that I have been working on ways to help you with more in-depth Excel Training than blog posts will allow.

You can already purchase my Introduction to Pivot Tables course and I do have plans for further training videos in the future, however your feedback in response to the survey I did back in March suggested an alternative route might be a better way to ensure that all of your needs are satisfied.

It became quite clear from the survey that:

  • Your needs are diverse, and everyone has different gaps in their knowledge;
  • A combination of video and written content was desirable;
  • To try to cover all of your requirements would be too much to do on my own.
Fortunately, I have since spent some time talking to an excellent organisation that already has these areas covered and it struck me that I wouldn’t really be providing you the best service to try to re-invent the wheel.
Excel With Business offer a 32 module Excel Training programme that covers everything you might want to know about Excel (and then some). What’s more, and this is the really neat trick, they provide a diagnostic test to determine your proficiency, so that you can focus on the areas that need attention – making the service ideal for beginners and experts alike.
If that doesn’t already tick all of your boxes, I have negotiated a deal with Excel With Business to offer you the tests and a full year’s access to all of the modules for 50% off the usual price. For full details, click here.
It is only fair that I make it clear that I will receive a commission on these sales, however I would be recommending this course to you if I didn’t – and the extra cash helps me to continue providing the blog content free of charge!
I believe that this course can really transform your use of Excel and I would strongly urge you totake a look at what is available.

If you enjoyed this post, go to the top of the blog, where you can subscribe for regular updates and get your free report “The 5 Excel features that you NEED to know”.


Excel Tip: Beware – Cut and Paste IS NOT the same as Copy and Paste

Cut and Paste

From the Not Just Numbers blog:

I hope those who celebrate it have enjoyed the Easter break.

I just have a short, but very important, post this week as we ease back into work.

This is a warning about the very significant difference between “cut and paste” (or “drag and drop”) and “copy and paste”, when it comes to Excel.

In most other applications, e.g. Word, the difference is negligible. Cutting or dragging moves the information (removing it from its old position) and copying does the same thing but leaves the original information in place too.

There is a far greater difference between these two methods in Excel and the implications of not understanding this difference can cause havoc with your spreadsheets.

The reason for the difference is the potential interconnected nature of the information being copied or moved in Excel. The cell being copied or moved may have formulae referring to it elsewhere in the spreadsheet, and/or may refer to other cells itself – a scenario that does not occur in most other applications.

When this is the case, Excel treats cutting and pasting very differently to copying and pasting.

Let us look at Copying and Pasting first as this is the simpler one. This has no impact on any cells referring to the copied cell. They still point at the original copy. However, when the copy is pasted elsewhere in the sheet, any cell references are treated as relative to the cell’s position. – so if the original formula referred to the cell above it, the copied formula would refer to the cell above the its new position. This can be overridden by using the dollar sign in the original formula.

Cutting and pasting, which is exactly the same as dragging and dropping, works very differently. This time, any cells referring to the moved cell are amended to refer to the cell in its new position. Also, all cell references to other cells are treated as absolute (whether or not the dollar signs are used).

Here is a simple table for ease of reference:

Copy and Paste Cut and Paste (or Drag and Drop)
References to other cells Treated as relative unless dollar sign is used on the original reference, as this forces Excel to treat the reference as absolute. All references treated as absolute.
Cells referring tothe moved cell No change. These still refer to theoriginal location of the cell. All formulae referencing the moved cell are amended to refer to the cell in itsnew position.


One of the biggest risks caused by not understanding this difference is users cutting and pasting, or dragging data within a data entry table, when formulae are looking along the row. For example, if a user drags the data in row 3 down to row 4 (maybe to make room to enter some new data in row 3), then all of the formulae referring to row 3 will now refer to row 4 (as will the formulae on row 4 that already refer to that row), however none of the formulae will refer to row 3.

Unfortunately, Excel does not provide an option to disable cut and paste, so users must be encouraged to always copy and paste instead (the contents of the original cells can then be deleted).

Be careful out there!

If you enjoyed this post, go to the top of the blog, where you can subscribe for regular updates and get your free report “The 5 Excel features that you NEED to know”.

Excel Tip: Presenting Pivot Table data in a fixed layout using GETPIVOTDATA

GETPIVOTDATAFrom the Not Just Numbers blog:

It’s been a while since I covered GETPIVOTDATA on the blog, so I thought it was worth a re-visit, but with the specific objective of demonstrating a structured approach to populating a fixed layout report, with data pulled from a pivot table.

NB: This post assumes that you already have, or know how to create, a pivot table containing your data. If not, you might find my video training course on the subject useful.

A very common example of this type of application is monthly management accounts: A pivot table can be great for doing the analysis and producing the numbers for the accounts, but these usually then need to be presented in a particular monthly accounts pack template.

This post will explain how to populate any fixed report with data pulled from a pivot table. This can be a great way of automatically populating any existing report that you might currently be populating manually.

One question that I am sure some readers will ask is “Why not use SUMIF and skip the pivot table altogether?”

This is a fair question and I sometimes take that approach, however one big advantage of the pivot table step is that you get to see ALL of the data summarised and can identify any data that is not appearing on the final report – SUMIFs on the other hand will only show what you look for, but you will not see any new categorisations that are not on the final layout (for example, a new nominal ledger code). Also, it is much easier to trace how a number is made up using the pivot table approach.

Let us take the pivot table report we produced in my cash book post:

NB: I have made one slight tweak to the one produced in that post, in that I have moved the year and month to be columns rather than report filter fields. This means that all years and months will appear as data is added, and our final report can pull out the month required.

The final template we use looks like this, and we normally key in the numbers from the pivot table (in reality, this might be a 30-page management accounts pack, but the principles are just the same as in our simple example):

Our objective is to automatically populate this in a structured way, from the pivot table.

We need to do a little preparation on the final report, by inserting 2 columns to the left of the report (these can be hidden, or kept outside of the print area, once we are finished).

In the first column, on the rows we need to populate, we enter exactly how that row is described in the pivot table. In the second column, we enter a 1 or a -1, depending whether we want to reverse the sign on that row or not.

So the report sheet now looks like this:

We will now build a formula that can be copied into every cell that we want to pull data into. We will create the formula in cell F5 and copy it to the others (NB: The totals are all just simple sums and are already in the template).

If you remember from my earlier posts on GETPIVOTDATA, the syntax of the function is as follows:

=GETPIVOTDATA(“Name of data field to return”,location of pivot table,”field1″,”item1″,”field2″,”item2″)
Where:
Name of data field to return is a text field, being the name of the pivot table field as it appears on the pivot table.
location of pivot table is a reference to a cell anywhere within the pivot table, it is often best to use the top left cell of the main body of the pivot table, as this will remain in a constant position no matter how much the data changes.
field1, item1,field2,item2,etc. are pairs of field and item names from the row, column or page (filter) areas of the pivot table. You can use as many pairs as you like. The field name comes from the original column heading in the data, the item name is the entry in that column that creates a unique row, column or page in the pivot table.

SO to return the figure we want, being the commission sales figure for month 11 of the year 2012, the GETPIVOTDATA formula would be:

=GETPIVOTDATA(“Value”,’Income and Expenditure’!$A$4,”Expense/Income Name”,”Consultancy Sales”,”Year”,2012,”Month”,11)

i.e. return the total of the field Value, from the Pivot Table at ‘Income and Expenditure’!$A$4 where Expense/Income Name is “Consultancy”, Year is 2012 and Month is 11.

For this formula to be able to be used throughout we need to change the values to references.

We can swap “Consultancy Sales” for $A5 (notice we place a dollar sign before the A, so that if we copy the formula to a different column, it will still look in column A for the Expense/Income Name).

We can swap 2012 for $F$2 (here we have used the dollar signs to fix both the row and the column as the year will always be in cell F2).

Finally we can swap 11 for $F$3.

So our new formula is:

=GETPIVOTDATA(“Value”,’Income and Expenditure’!$A$4,”Expense/Income Name”,$A5,”Year”,$F$2,”Month”,$F$3)

There are a couple of additional changes that we need to make to complete the formula before we copy it to the other cells.

This formula works great if there is a figure in the pivot table for the year, month and category in question, but will return an error otherwise, so we need to catch that and return a zero. I covered this in a post a couple of years ago (EXCEL TIP: Eliminating #DIV/0! and other errors automatically using ISERROR). In later versions of Excel, you can use IFERROR to replace the two functions IF and ISERROR, however I don’t see that this makes the formula any simpler, yet stops it working in earlier versions, so we will stick to IF and ISERROR here. The new formula is now:

=IF(ISERROR(GETPIVOTDATA(“Value”,’Income and Expenditure’!$A$4,”Expense/Income Name”,$A5,”Year”,$F$2,”Month”,$F$3)),0,GETPIVOTDATA(“Value”,’Income and Expenditure’!$A$4,”Expense/Income Name”,$A5,”Year”,$F$2,”Month”,$F$3))

Finally, we need to reflect the column we added to allow us to reverse the sign. In our example, the pivot table has sales (credits) as a positive and expenses (debits) as a negative (if this had come from a traditional trial balance, they would have been the other way around). In our final report, we want to show both as positives and the totals will deduct expenses from sales, so we have entered 1 against the rows that we want to keep with the same sign and -1 against the expenses, where we want to reverse the sign.

This is simple to reflect in the formula as we just need to multiply the result by column B:

=IF(ISERROR(GETPIVOTDATA(“Value”,’Income and Expenditure’!$A$4,”Expense/Income Name”,$A5,”Year”,$F$2,”Month”,$F$3)),0,GETPIVOTDATA(“Value”,’Income and Expenditure’!$A$4,”Expense/Income Name”,$A5,”Year”,$F$2,”Month”,$F$3))*$B5

Note that we have again used the dollar sign to fix the column, but not the row.

We can now copy this formula into cells F6 and E10 to E13.

Our final report now looks like this:

The numbers will now all automatically update if the pivot table changes or if the year and/or month are changed at the top.

This approach works with far more complex reports than this and can be expanded to allow for multiple value fields in the pivot and multiple columns in the final report.

I use this approach regularly to automatically populate existing reports for clients. They often have very elaborate reports that take ages to complete manually. With this approach, I can insert a couple of columns and work out the formula, without changing the look of their report at all.

Go on, revisit all of those manual reports now. You’ll be glad you did when next month end comes around!

If you enjoyed this post, go to the top of the blog, where you can subscribe for regular updates and get your free report “The 5 Excel features that you NEED to know”.

Excel Tip: Using Goal Seek

Goal SeekFrom the Not Just Numbers blog:

Before we get into this week’s post, I’d just like to say a big thank you for the magnificent response to my survey last week. I will reflect your feedback in the new training product I am currently developing, and which I expect to launch in the next few weeks.

This week’s post is a short one on a useful little tool that Excel has tucked away. The Goal Seek tool is particularly useful when working with financial forecasts. Here we will show how to use it to find the break-even point.

Say you have a complex forecasting model with many interlinked variables, and you want to know what your break-even sales volume is. Goal Seek is designed for exactly this type of scenario.

What Goal Seek actually does is adjust one cell, to achieve a desired result in another cell that is ultimately dependent on the first cell. In the break-even example, we need to know what sales volume returns zero net profit.

We will use an incredibly simple example to illustrate the tool, but it really comes into its own the more complex the model is.

In the following spreadsheet, the white cells represent entered variables and the rest of the spreadsheet is calculated from these:

So, the formulae in cells B8 to B12 are as follows:

B8: =B3*B4
B9: =B3*B5
B10: =B8-B9
B11: =B6
B12: =B10-B11

We want to know what value in cell B3 will result in zero Net Profit in cell B12 (assuming the other variables stay the same). This will give us the break-even sales volume.

We select the Goal Seek tool by going to the Data ribbon, clicking What-If Analysis and selecting Goal Seek… We then populate it as follows:

Excel puts the dollar signs in when we click in the appropriate cells.

When we click OK, the Goal Seek tool will adjust cell B3 until cell B12 is equal to zero as follows:

Job done!

Obviously with our simple model we could have arrived at this ourselves quite easily, however the tool also works with complex models involving multiple sheets and many interlinked formulae.

Happy Goal-Seeking!

If you enjoyed this post, go to the top of the blog, where you can subscribe for regular updates and get your free report “The 5 Excel features that you NEED to know”.