Excel Tip: INDEX and MATCH – an alternative to VLOOKUP (and HLOOKUP)

INDEXMATCH

From the Not Just Numbers blog:

In my last post I described how to use both VLOOKUP and HLOOKUP to lookup and return data from lists or tables. Whenever I mention these functions in forums, etc. I usually get someone reminding me of how inefficient they are in terms of resource and how I should be using INDEX and MATCH.

I believe both approaches have their place – and use both where appropriate.

In a world of high speed processors and massive amounts of RAM (even on entry-level PCs), the resource issue t
On the other hand, INDEX and MATCH are incredibly powerful, more flexible and are less resource iends to only become relevant for those handling significant volumes of data. Meanwhile it is usually easier for most users to understand and use VLOOKUP and HLOOKUP.

ntensive for high volumes of data.

Horses for courses!

So for those of you who do deal with large volumes of data, or who are looking for greater flexibility than VLOOKUP and HLOOKUP can provide, here is how to do lookups using INDEX and MATCH.

First of all, let’s introduce the two functions:

INDEX is a function for returning a cell or range from within an array. At its simplest level this is done by referring to the cell by its row and column number (INDEX can do quite a bit more than this and also has another form which allows you to look at multiple ranges, however we only need to use its simple form here – I may do a post on some of its more advanced features at a later date). The simple form of INDEX is as follows:

=INDEX(range,row,column)

Column can be omitted and, if so, it is assumed to be 1 – unless range is just a single column in which case Excel will assume that the omitted argument is the row.

So for example:

=INDEX(A1:D5,2,3) returns the value in C2

MATCH finds the position of a value in a single row or column range. Its syntax is:

=MATCH(lookup value,range,match type)

match type is optional and has the following three possible values:

1 (or omitted)  – finds the position of the largest value that is less than or equal to lookup value and requires the range to be in ascending order (this works the same way as using TRUE for the 4th argument in a VLOOKUP).

-1  – finds the position of the smallest value that is greater than or equal to lookup value and requires the range to be in descending order.

0  – finds the position of the first value that is exactly equal to lookup value (this works the same way as using FALSE for the 4th argument of VLOOKUP). In this case, the range can be in any order.

So if the range A1:A10, contains the values 5,6,3,8,12,4,9,34,23,54, then

=MATCH(4,A1:A10,0) returns 6, i.e the lookup value (4) appears 6th in the list.

Hopefully you are now starting to see how both these functions can combine to replicate a VLOOKUP (or HLOOKUP). We simply replace the row or column argument in the INDEX function with a MATCH function.

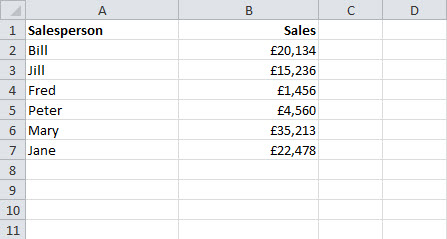
So for example in the following range:

=VLOOKUP(“Mary”,A2:B7,2,false) will return £35,213

We can do exactly the same with INDEX and MATCH.

Using INDEX, =INDEX(A2:B7,5,2) returns the same answer, but we had to know that Mary was on the 5th row of the range.
Fortunately we know how to tell which row Mary is on using the MATCH function:

=MATCH(“Mary”,A2:A7,0) will return the position of Mary in the range (i.e. 5).

We can simply replace the row number in the INDEX function with the MATCH function and we have exactly the same functionality as the VLOOKUP:

=INDEX(A2:B7,MATCH(“Mary”,A2:A7,0),2) returns £35,213.

Although the result is the same, I am assured by those who know about these things that Excel handles the INDEX and MATCH version in a much more efficient way. Another advantage of this approach is that the lookup values don’t have to be in the first row or column.

So, it is well worth having this approach in your arsenal, whether or not you choose to ditch VLOOKUP forever!

If you enjoyed this post, go to the top of the blog, where you can subscribe for regular updates and get your free report “The 5 Excel features that you NEED to know”.

Excel Tip: VLOOKUP or HLOOKUP?

lookup

From the Not Just Numbers blog:

Many of us use VLOOKUP regularly and I know I’ve covered it a number of times on the blog, but what about its poor relation, HLOOKUP?

I regularly come across users who don’t know it exists – or if they do, don’t know what it is for.

This is a shame, as if you understand VLOOKUP, it is very easy to grasp HLOOKUP and sometimes it is exactly what you need.

In this post I will cover VLOOKUP again for completeness and then describe how HLOOKUP differs.

Put simply, HLOOKUP works exactly the same as VLOOKUP, except that it works horizontally rather than vertically (that’s what the V and the H stand for).

Where VLOOKUP enables you to search down a vertical list to return a value from further along that row, HLOOKUP searches along a horizontal list and returns a value from further down that column.

To recap on VLOOKUP:

=VLOOKUP(lookup value,range to lookup,column to return,TRUE or FALSE)

lookup value: This is the value you wish to search the first column of your table for (this can be the actual value, but it can be very powerful to refer to a cell containing the value).
range to lookup: This is the range (either named, or referred to directly) that contains the lookup table. It is useful to refer to whole columns as this allows your list to grow.

column to return: This is given as a number, where the first column (the one being searched) is 1.

TRUE or FALSE: This is a rather odd one. If you enter ‘TRUE’ or omit this argument, Excel will go to the closest value if the actual value being looked up is not there. This requires the first column to be sorted in ascending order. For most financial applications you will need to enter ‘FALSE’ here as this will return an #NA error if it cannot find the lookup value. For a fuller explanation of applications where you would use TRUE, take a look at EXCEL TIP: Look up commission or tax rates from earning bands.

HLOOKUP works in exactly the same way, so for HLOOKUP:
=HLOOKUP(lookup value,range to lookup,ROW to return,TRUE or FALSE)

lookup value: This is the value you wish to search the first ROW of your table for (this can be the actual value, but it can be very powerful to refer to a cell containing the value).

range to lookup: This is the range (either named, or referred to directly) that contains the lookup table. It is useful to refer to whole ROWS as this allows your list to grow.

ROW to return: This is given as a number, where the first ROW (the one being searched) is 1.

TRUE or FALSE: This is a rather odd one. If you enter ‘TRUE’ or omit this argument, Excel will go to the closest value if the actual value being looked up is not there. This requires the first ROW to be sorted in ascending order. For most financial applications you will need to enter ‘FALSE’ here as this will return an #NA error if it cannot find the lookup value. For a fuller explanation of applications where you would use TRUE, take a look at EXCEL TIP: Look up commission or tax rates from earning bands.

HLOOKUP deals with a situation where your data is in columns and you want to pull data from a column based on the column heading.

If you enjoyed this post, go to the top of the blog, where you can subscribe for regular updates and get your free report “The 5 Excel features that you NEED to know”.

Excel Tip: A simple dependent drop-down list

drop-down listsFrom the Not Just Numbers blog:

I have previously blogged about how to create a drop-down list in Excel using data validation, but sometimes I am asked to make the options in one drop-down list dependent on the selection from another.

This can be done pretty simply if all you want to do is present different lists based upon the selection from the first drop-down.

For example, we might have a drop-down to choose product group and then a second drop-down to choose an actual product from that group. In the second drop-down, we want to only show the products in the chosen product group.

So here goes…

The first task is to layout the lists in a way that makes this possible:

As you can see above , we have entered the product groups along row 1, with the products contained in each below them.

We then need to name the following ranges on this sheet as follows:

GroupList    A1:C1
ProductList1  A2:A51
ProductList2  B2:B51
ProductList3  C2:C51

I have assumed that we only have 3 product groups and up to 50 products in each, but obviously these can be changed to suit the data.

We then want to create the two drop-downs on a separate sheet – let’s say in cells A1 and B1.

The Product Group drop-down in cell A1 is just an ordinary drop-down, where we select Data Validation -> List and enter =GroupList in the Source box (my earlier post explains this in more detail).

The second drop-down is the one that does the work. I will tell you what we do first and then explain it.

In cell B1 (where we want the product drop-down), we again select Data Validation -> List but this time enter the following into the Source box:

=INDIRECT(“ProductList”&MATCH(A1,GroupList,0))

we should also untick Ignore blank as there are blank cells in the product ranges we selected. If we leave this ticked, Excel will still present the drop-down list, but allow anything to be typed into the cell.

That’s the job done – this will now provide a drop-down of the right products for the chosen product group.

So, what is this formula doing?

There are three elements that we need to understand to decipher the formula:

=INDIRECT() forces Excel to recognise whatever is contained in the brackets as an address or range. We have applied this to the formula so that the Data Validation source box recognises that this is a range, rather than a piece of text.

=MATCH(A1,GroupList,0) searches for the value A1, within the range GroupList. The third argument (0) tells the function that it should only look for an exact match. The result is the position as a number, i.e. if it finds A1 in the first cell of GroupList, it returns 1, etc.

The & symbol combines two pieces of text together into one string.

Putting all three together, if cell A1 was to contain “Product Group B”, then the Match formula would return 2 (as this appears in the second cell of GroupList).

So “ProductList”&MATCH(A1,GroupList,0)  =  the text string “ProductList2”

and =INDIRECT(“ProductList2”) is therefore the range named ProductList2, i.e. the range name we gave to the list of products in Product Group B.

Obviously, the names of the ranges can be changed depending on the data, as long as the dependent list ranges all end with their position.

If you enjoyed this post, go to the top of the blog, where you can subscribe for regular updates and get your free report “The 5 Excel features that you NEED to know”.

Excel Tip: Quickly fix formulae copied from another spreadsheet

FixFormulae

From the Not Just Numbers blog:

This week I have a simple tip to solve a very specific problem, but one that many users will encounter regularly.

Many times when building spreadsheets, I have a set of formulae that do what I want in one workbook that I want to copy to a similar workbook with the same worksheet names.

If you’ve tried to do this, you will know it is not as straightforward as it sounds.

For example, if I have 5 sales reporting spreadsheets in the same format for 5 group companies, I might have an invoice layout in one worksheet (let’s call this sheet Invoice) that pulls information from a list of sales invoices on another worksheet (called Data).

If I decide to redesign the layout of all invoices to follow a new format across the group, it would make sense to do this once and copy it to the other 4 when I am happy.

When I copy the new layout and paste it into the Invoice sheet of one of the other companies, all of the formulae automatically link to the Data sheet in the first spreadsheet by adding the file path to the cell references (not what I want).

Where I could approach this with some careful use of Find and Replace, there is a quicker, simpler way that will address the problem for the whole workbook.

Excel stores the names and locations of any spreadsheets that it links to in a table that you can access by clicking “Edit Links” on the Data ribbon (in Excel 2003 or earlier, choose “Links…” from the Edit menu).

Click on the name of the external worksheet in the list of sources (unless you have other links to external spreadsheets in this workbook, it will be the only one there).

Click the “Change Source” button on the right and browse to the location of the new workbook (the one that you are in) and click OK.

The link will disappear from the list as it is no longer an external link – all formulae are now referring to the corresponding location in the new workbook, rather than to an external workbook.

You can check your formulae now and the file paths will have disappeared.

This becomes even more useful when you are copying many formulae in multiple sheets across from one workbook to another – as this process redirects every reference to the original sheet to the new one.

If you enjoyed this post, go to the top of the blog, where you can subscribe for regular updates and get your free report “The 5 Excel features that you NEED to know”.

Excel Tip: Simple tips for tidying up text in Excel

Tidy up textFrom the Not Just Numbers blog:

Although we might do our best to use data validation to ensure text is correctly entered into a spreadsheet, we very often need to deal with data from other sources that might not be well controlled.

Often one of the biggest issues in dealing with data to make it useable is tidying up text, so that names, departments, addresses, etc.are entered consistently.

Once this tidying up exercise is done, these text fields become useful for filtering the data using autofilter, or pivot tables – or for looking up information from other lists.

A simple approach to take is to work on creating a formula that deals with most of the problems, then copying this down alongside the text list. Then, when we are happy, we can copy this column and paste special (as text) where we want the text to be – if this is a one-off exercise – alternatively we can use the calculated column to drive the reports if it needs to handle new data being added in future.

Excel provides a number of tools that can help to clean up the data.

Removing extra spaces

One of the particularly sticky problems with entered text is extra spaces – particularly because they are so hard to spot. Excel provides a nice simple solution to this, the TRIM function.

=TRIM(text) strips all spaces out of a text string, except single spaces between words.

text can be actual text which must be enclosed in quotation marks (i.e.”text”) or, as we would use for this purpose, a cell reference containing the text (e.g. A1).

That means that it will remove any spaces at the beginning or end of the text, as well as ensuring that any spaces between words consist of only one space. If they include more than one space, the extra spaces will be removed.

Correcting the case

Particularly where data is to be presented in some way, one big concern can be what case the text is using. This may be all on capitals (rarely looks good on a report), or worse – it might be an inconsistent mix of capitals and lower case.

Excel has three functions to handle this.

=LOWER(text) presents the text entirely in lower case, irrespective of its original case.

=UPPER(text) presents the text entirely in upper case, irrespective of its original case.

=PROPER(text) presents the text in lower case with a capital letter at the start of each word, again irrespective of its original case.

Comparing to valid data

Where the above functions might remove some relatively standard problems, we will often still have to do some editing to completely tidy the list. The time spent doing this can be considerably reduced if we can get Excel to tell us which ones we need to correct.

One of the simplest ways to do this is to use COUNTIF to compare the text to a list of valid options (almost retrospective data validation).

COUNTIF counts the number of instances in a range that meet certain criteria.e.g.

=COUNTIF(Sheet2!$A:$A,B1) counts the number of cells in column A of sheet 2, that contain the value (or text) contained in cell B1.

If column A of Sheet2 contained our list of valid values and column B of the current worksheet contained the text we wanted to correct, then all of the invalid entries will return a 0, which we can then filter the list by to show all of the rows that need correcting.

Happy tidying!

If you enjoyed this post, go to the top of the blog, where you can subscribe for regular updates and get your free report “The 5 Excel features that you NEED to know”.

Excel Tip: How to combine multiple sets of data for a pivot table – a practical solution

Consolidate multiple tablesFrom the Not Just Numbers blog:

I have written many posts about the benefits of pivot tables and how to prepare data for use in them, but there is one scenario that I haven’t covered which I come up against every now and again with clients. What if we have multiple sets of similar data that we wish to report across using a pivot table?

An example might be where we are comparing sales reports at a group level and are provided with a list of sales invoices from each of three departments or subsidiaries. To complicate matters further, the three departments use different invoicing systems and therefore the lists are in different formats.

Excel has a facility to consolidate ranges in a pivot table but this is for a very specific scenario and I, personally, have yet to find a practical use for this. It certainly does not help us here.

The good news though, is that I have developed a way of approaching this problem that works every time, and is pretty straight-forward.

To include them all in one pivot table, we will need them all in one list with one set of headings. And we want to do this in such a way that the work is already done for next month.

To start with we import, or paste, the three lists into their own individual tabs within our workbook.

We then set up a fourth tab and enter the column headings that we want to use for our consolidated table. These might be Date, Invoice Number, Salesperson, Customer, Amount. We also add an extra column for Department.

We want to allocate a section of the consolidated list to each of these departments.

Before we do that, we need to look at the typical size of each of these lists. Say that each is typically 2,000 rows – we might want to allocate 10,000 rows to each department to allow plenty of slack.

We now populate the first row of the consolidated sheet as follows.

In cell A2 (the first cell in the Date column), we enter a formula to pull the date from the first row of department 1. In cell B2 (the first cell in the Invoice Number column), we enter a formula to pull the Invoice Number from the first row of department 1, etc.

So, if department 1’s data is held on a sheet called Department1 and the date is in column C and the Invoice Number is in column F, then on the consolidated sheet, cell A2 contains

=Department1!C2

and cell B2 contains

=Department1!F2

when this has been done for each of the columns we then enter the name of the department in the department column and copy the whole row down all the way to row 10,000.

Then in row 10,001 we do the same for the first row of department 2 (obviously referring to the correct columns for department 2 as these may be different. We then copy this down to row 20,000 and repeat again for department 3 on row 20,001.

We can then use these 30,000 rows as the source range the pivot table, allowing us to report across the departments, and by department thanks to the department column we added.

Next month we just have to import or paste the new data over the old data for each the three departments and the consolidated list will automatically update.

If you don’t know how to create the pivot table itself, take a look at my earlier post, or you canpurchase my Introduction to Pivot Tables video course here. If you’re quick and do this by 31st January 2013, you can get it for half price.

If you enjoyed this post, go to the top of the blog, where you can subscribe for regular updates and get your free report “The 5 Excel features that you NEED to know”.

Why do I need pivot tables? – and a song!

Why do I need Pivot Tables?

From the Not Just Numbers blog:

Before we get to the song, I want to answer a question I am asked over and over again:

“Why do I need pivot tables?”

Regular readers will know what a big fan I am of pivot tables, and how they can transform how you use Excel. However the biggest obstacle that people seem to face is not that pivot tables are complex, but that they don’t understand what they are for.

In short, Pivot tables allow you to analyse and summarise large amounts of data quickly, easily and incredibly flexibly (if that’s  word!).

Quickly:

It can take seconds to transform tens of thousands of rows of data into a summary table, displaying the important information you need to see.

For example: from a list of sales invoices pulled from your accounting system, you can create a 12 month sales summary by customer with a column for each month. That should typically take less than a minute to create from scratch.

Easily:

Building pivot tables is all done with wizards and the layout is built visually using drag and drop – no complicated coding just a simple way to analyse your data.

Flexibly (if it’s not a word, it should be):

In the sales summary example above, what if you (or your boss) now wants to see the same sales summary by salesperson and region, rather than by customer. This can be done in about 20 seconds. Just think if you’d built that summary without pivot tables – how long would it take to change it?

If I’ve convinced you that you need to know more about pivot tables, you can still take advantage of my January deal if you’re quick. Just click here and you can have mastered pivot tables within the next hour.

Or alternatively, maybe these boys can convince you with a song:


If you enjoyed this post, go to the top of the blog, where you can subscribe for regular updates and get your free report “The 5 Excel features that you NEED to know”.

How to create an Excel Pivot Table

Excel Pivot Table

From the Not Just Numbers blog:

I am a huge fan of Pivot Tables as they can completely transform your ability to analyse and report on data in Excel and thought it was about time I did a post on them. Then I had a better idea…why don’t I let you watch the first video in a training course that I developed with Emily Coltman a few years ago?

This video shows you step-by-step how to create your first Pivot Table. Then I had an even better idea…why not let you have the full course for half price as an exclusive offer for Not Just Numbers readers.

After you’ve watched the video, just click the link above to get the full course for just £9.75 (or $14.75 if you prefer) – but hurry, the offer is only available until the end of January. After that you can still buy it but at the full price.

Here’s the video:

Create an Excel Pivot Table

And don’t forget to take advantage of your exclusive January offer.

If you enjoyed this post, go to the top of the blog, where you can subscribe for regular updates and get your free report “The 5 Excel features that you NEED to know”.

Excel Tip: Using CHOOSE – or do you need OFFSET, or maybe INDEX?

Choose

From the Not Just Numbers blog:

How are those New Year Resolutions coming along now we’re all back to work?

Did you set your Excel ones? I’d still love to hear what they are.

Just a couple of quick messages  before we get into today’s post.

First of all, if you’re not a subscriber to the blog and therefore didn’t get my exclusive Christmas video showing you how to use drop-down lists, I have decided to give you one more chance. I will send it out again at the weekend to any new subscribers that have signed up by the end of this week. So get yourself subscribed now in the box at the top right of the blog – if only to laugh at me in a Santa hat!

Secondly, I have made a few changes to the colour scheme of the blog – to freshen it up for the New Year. I would really appreciate any feedback on the changes, both positive and negative – as well as any other suggestions for changes to the layout of the blog.

Well, on with the post…

Tom, an accountant in Australia and regular Not Just Numbers reader, asked the following when I asked to hear what you wanted to learn from the blog:

“I’d like to learn about the CHOOSE function and using this for selecting data from another area of a worksheet (I am not sure if this would be used in conjunction with OFFSET?)”

Well Tom, the CHOOSE and OFFSET functions both perform a similar function – but in different circumstances.

I have covered the OFFSET function before, so I thought I would introduce the CHOOSE function and then explain how to determine which one you need. And then show you why INDEX might be better anyway!

The CHOOSE Function

The CHOOSE function is pretty simple and is used to select from a fixed list as follows:

=CHOOSE(position in list,item1,item 2, etc.)

so =CHOOSE(3, “A”,”B”,”C”,”D”) returns C, being the third item in the list.

The list can contain up to 254 items.

You could use cell references as the list items, e.g.

=CHOOSE(3,A1,B1,C1,D1) will return the contents of cell C1.

Or you could even use ranges as long as you told Excel what you wanted to do with the range, e.g.

=SUM(CHOOSE(3,A1:A3,B1:B3,C1:C3,D1:D3)) returns the sum of cells C1 to C3.

The OFFSET function

I will not go into the full workings of the OFFSET function here as you can read about itin my earlier post.

You could though use the OFFSET function for either of the last two options:

=OFFSET(A1,0,2) returns the contents of C1

(notice an offset of 2 columns returns the third item here as the first item (A1) would be an offset of zero columns)

=SUM(OFFSET(A1,0,2,3)) will return the sum of the range C1 to C3, being offset by zero rows and two columns and having a height of 3.

OFFSET can be far more flexible and and easy to use, particularly as the list gets longer., however will not work if the list contains ranges of differing sizes (in which case you would need to use CHOOSE).

In most cases when the items on the list are held in the spreadsheet, OFFSET will be the better choice – except where you need to select from different size ranges as mentioned above.

The INDEX function

The INDEX function is an alternative to OFFSET which can be a little more complicated to understand, but  makes a better use of resources – which is particularly important if your spreadsheet is getting large and cumbersome.

INDEX has two forms, but for this purpose, we only need to worry about the more common one:

=INDEX(Array,Row Number,Column Number (optional))

The function then returns the value from the array at the intersection of row and column. If the array is only one row high or one column wide then you only need include either the row or column number. Also, a row or column number of zero will return the whole row or column as a range.

So…

=INDEX(A1:C1,3) will return the contents of C1

and…

=SUM(INDEX(A1:C3,0,3)) will return the sum of cells C1 to C3

I hope that helps you Tom, as well as everyone else!

If you enjoyed this post, go to the top of the blog, where you can subscribe for regular updates and get your free report “The 5 Excel features that you NEED to know”.

What are your Excel New Year’s Resolutions?

Happy New Year

From the Not Just Numbers blog:

I’d like to take this opportunity to wish all of my readers around the world, a very Happy New Year.

To those of you in Australia and New Zealand, whose New Year’s Day will already be coming to an end, to those in North America, some of whom will still be out celebrating New Year’s Eve, to those of us in the UK just waking up with hangovers, and to my readers in every other country of the world, I hope this brand new year brings you everything you hope for.

But coming back to Excel, what are your Excel-related plans for the new year?

What changes do you plan to make in how you use Excel, to get more out of it in 2013? I’d love to hear about them in the comments.

If you’re not sure, I have a few suggestions to get you started. These have all served me well and would certainly improve your Excel spreadsheets, if you’re not already doing them. So, here goes…

For my part, I have resolved to do the following in 2013:

  • Have a proper dig around in Excel 2013 to highlight the best bits to you;
  • Likewise for PowerPivot, one of the 2010 features I still haven’t spent enough time on;
  • Develop a series of video training courses for those of you who want to learn in more depth than a blog post allows.
Thanks for all of your contributions in 2012 and I look forward to working with many more of you in 2013.
Don’t forget to leave your resolutions in the comments!
Happy New Year.


If you enjoyed this post, go to the top of the blog, where you can subscribe for regular updates and get your free report “The 5 Excel features that you NEED to know”.